

30- Generate Gaussian Noise
Section 1: What is mean by Noise.
So we know that randn generates Gaussian noise. Let's see how it actually works. If you call randn without any parameters, then it returns a random number. Here we get 0.76388.


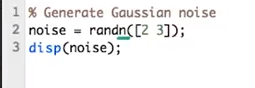
Run it again. A different number, 1.3958. You can pass in dimensions to randn to generate a vector or matrix filled with random numbers. Let’s say we want a row vector of five columns. So one row, five columns. Each time we run this, we get different sets of numbers. As you might have guessed, we can generate a two dimensional matrix of random numbers as well. Say we want two rows and three columns.

Since these are a bunch of random numbers, we call this noise.
Section 2- Gaussian or a random normal distribution
What is interesting is that randn draws these numbers from a Gaussian or a random normal distribution. Hence, the n in randn. A Gaussian distribution has a probability distribution function that looks like this.
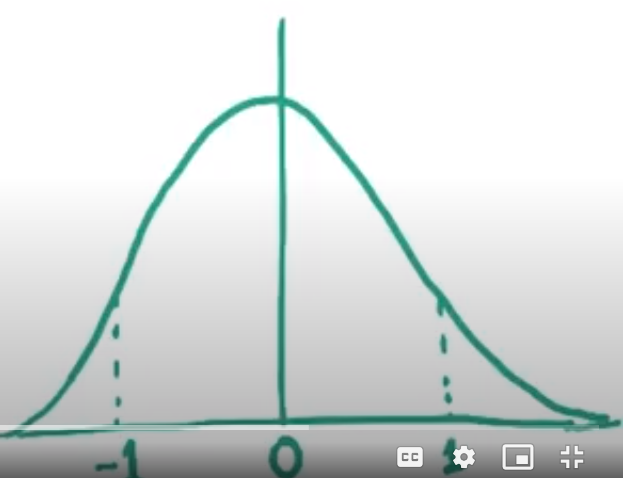
The center, or mean, for randn is zero, and the standard deviation is one. The standard deviation is a measure of how spread out the distribution is. I mentioned this is a probability distribution, which means getting back numbers that are close to zero is highly likely, whereas numbers far away from zero are less likely.
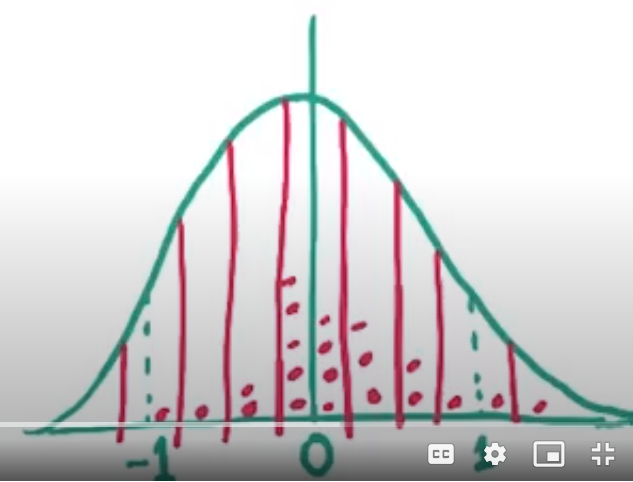
How do we do know for sure that randn is actually sampling from a Gaussian distribution? Well, if we had enough samples and distributed them among bins and we counted how many numbers landed in each bin, then we would see a pattern similar to the probability distribution function.

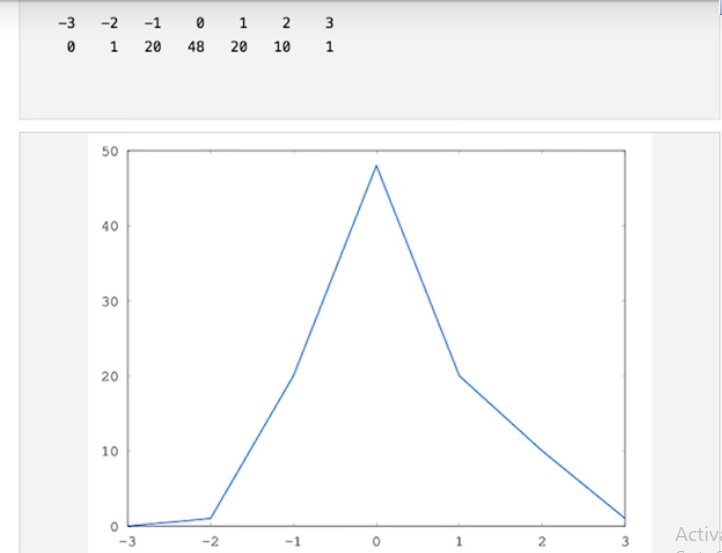
Let's try that. How about we start with a vector of hundred numbers? Instead of displaying the numbers directly, let's compute a histogram. Hist accepts a vector or matrix of numbers as a first argument and as an optional second argument, you can pass in bin centers. Let's say we want the centers to be integers, from minus three to plus three. Hist returns two values. One is the count of elements, which we want, and the second is the bin centers. Let us display the bin centers and the columns in a tabular form. We will create a small, temporary matrix, with the first row being the bin centers and the second row being the counts. As expected, the center has a high count, and the ends have low, in fact, zero counts. You see the same behavior no matter how many times you run it. For a visual representation of what's going on, how about we plot these numbers? X-axis will contain our bin centers, and the counts will be on the y-axis. We see something that vaguely resembles the Gaussian probability distribution.
To get a better picture, we need more bins. You can generate a sequence of uniformly spaced numbers using the lint space function. Here we can replace this vector by writing minus three to plus three, seven different numbers. That is including zero. Let's make sure this is the same as before. Note here that the bin centers are same, as expected. Now we can easily increase the number of events. Say, we want 21 one of them. I'm going for odd numbers because I want to include the zero in the middle. Displaying so many numbers wouldn't be useful, so let's comment that out and see what the plot looks like. Clearly, we have better resolution along the x-axis, but what's going on with these spikes? I think we need more data, let's bump up the vector to 1,000 numbers. Now you see the familiar bell curve slowly emerging. Let's increase the number of samples further. There you go. In addition to randn, you can find other random number generation functions in Octave or MATLAB such as just rand. This samples numbers from a uniform distribution. Randi generates random integers. Feel free to play with these functions.


Section 3-Generate Gaussian Noise using Python
To generate Gaussian noise in Python, you can use the NumPy library, which provides a convenient function for this purpose. The numpy.random.normal function generates random samples from a normal (Gaussian) distribution.
Here's an example of how you can generate Gaussian noise using Python:
import numpy as np
import matplotlib.pyplot as plt
# Set the mean and standard deviation of the Gaussian distribution
mean = 0
std_dev = 1
# Set the number of samples
num_samples = 1000
# Generate Gaussian noise
gaussian_noise = np.random.normal(mean, std_dev, num_samples)
# Plot the histogram of the generated Gaussian noise
plt.hist(gaussian_noise, bins=50, density=True, alpha=0.6, color='g')
plt.title('Generated Gaussian Noise')
plt.xlabel('Value')
plt.ylabel('Frequency')
plt.show()